For our DxOMark camera sensor reviews, we measure the image quality performance only of camera sensors that are capable of capturing images in RAW format, and we do this before demosaicing or any JPG processing has taken place. You can read more about the DxOMark approach to image quality measurement and why we base our testing on RAW image files here. In this article, we explain how we test for different criteria in the DxOMark image quality test lab and how the test results translate into sub-scores and the final product scores.
We measure camera sensors for the following criteria:
- Color sensitivity
- Noise (standard deviation, signal-to-noise ratio, dynamic range, and tonal range)
- ISO sensitivity (speed)
The DxOMark use case scores and overall score for camera sensors
We have defined three use case scores on which to base our camera sensor reviews — Portrait, Landscape, and Sports — which all report on different aspects of sensor performance. Each use case score is associated with one of the image quality metrics mentioned above, and defined as follows:
Portrait score: Color Depth
Flash studio photography involves controlled lighting, and even when shooting hand-held, studio photographers rarely move from the lowest ISO setting of their cameras. What matters most when shooting products or portraits is a rich color rendition and color depth. The best image quality metric that correlates with color depth is color sensitivity, which indicates to what degree of subtlety color nuances can be distinguished from one another (and often means a hit or a miss on a pantone palette). Maximum color sensitivity reports in bits the number of colors that the sensor is able to distinguish.
The higher the color sensitivity, the more color nuances can be distinguished. As with dynamic range, color sensitivity is greatest when ISO speed is minimal, and tends to decrease rapidly with rising ISO settings. In DxOMark testing we measure only the maximum color sensitivity. A color sensitivity of 22bits is excellent, and differences below 1 bit are barely noticeable.
Landscape score: Maximum Dynamic Range
Landscape photographers carefully compose their images and choose the time of the day for shooting in the best light. This type of photography commonly involves mounting the camera on a tripod and using the lowest possible ISO setting to minimize noise. Unless there is motion in a scene, relatively long shutter speeds are not an issue with a tripod. On the other hand, dynamic range is paramount. Photographers will often aim for detail in high-contrast settings, juxtaposing a bright sky with shadowy foliage or mountain ranges. Ideally, the dynamic range of the camera should be greater than the dynamic range of the scene, otherwise details in shadows are lost or highlights are burned.
Dynamic range falls rapidly with higher ISO settings, as any analog or digital amplification performed will increase the noise in the darker areas, making it harder to distinguish among fine levels of contrast. Maximum dynamic range is the greatest possible amplitude between light and dark details a given sensor can record, and is expressed in EVs (exposure values) or f-stops, with each increase of 1 EV (or one stop) corresponding to twice the amount of light.
Dynamic range corresponds to the ratio between the highest brightness a camera can capture (saturation) and the lowest brightness it can capture (which is typically when noise becomes more important than the signal — that is, a signal-to-noise ratio below 0 dB). A value of 12 EV is excellent, with differences below 0.5 EV usually not noticeable. Dynamic range is an open scale.
Sports & action score: Low-Light ISO
Unlike the two previous scenarios in which light is either generous (studio) or the camera can be mounted on a tripod (landscape), photojournalists and action photographers often struggle with low available light and fast motion in the scene. When shooting sports or action events, the photographer’s primary objective is to freeze motion, giving priority to short exposure times. To compensate for the lack of exposure, photographers have to increase the ISO setting, which results in a decreased signal-to-noise ratio (SNR). How far can ISO be increased while maintaining decent image quality? The DxOMark low-light ISO metric will give you this information.
The SNR indicates how much noise is present in an image compared to the actual image information (signal). The higher the SNR value, the better the image quality, as detail is not drowned out by noise. The SNR is given in dB, which is a logarithmic scale: an increase of 6 dB corresponds to doubling the SNR, which in turn equates to half the noise for the same signal. A SNR value of 30dB means excellent image quality. We have therefore defined low-light ISO as the highest ISO setting for a camera that allows it to achieve a SNR of 30dB while keeping a good dynamic range of 9 EVs and a color depth of 18bits. A difference in low-light ISO of 25% equals 1/3 EV and is only slightly noticeable. Low-light ISO is an open scale.
Sensor Overall Score
The Sensor Overall Score is an average of the three use case scores above: the Portrait Score based on color depth, the Landscape Score based on dynamic range, and the Sports Score based on low-light ISO. The Sensor Overall Score shows a camera’s:
- Sensor quality in terms of noise
- Ability to render high contrast
- Threshold for the formation of colored noise
- Ability to shoot in low light
However, the Sensor Overall Score does not show a camera’s resolution and ability to render fine detail, nor does it take into account optical aberrations, as those criteria depend on the lens used with the camera (see our article about lens scoring. It is worth keeping a few additional points in mind when reading DxOMark camera sensor reviews:
- The Sensor Overall Score is logarithmic: A 5-point difference on the scale corresponds to a gain or loss of sensitivity of 1/3 of a stop.
- The Sensor Overall Score is normalized for a defined printing scenario of 8 Megapixels printed on a 8×12-inch (20cm x 30cm) size at 300 dpi resolution. Any other normalization, even at a higher resolution, would lead to the same ranking, given that any camera that cannot deliver the chosen resolution is eliminated from the comparison.
- The Sensor Overall Score is open and not a percentage: The score is computed so that current camera models, from low-end DSCs up to professional DSLRs and medium-format cameras, score within a range from 0 to 100. However, new technologies may well lead to scores higher than 100 in the future.
Let’s take a closer look at the setups and methodologies used in the DxOMark test lab to measure the individual test criteria that feed into out Overall Sensor Score.
Noise and dynamic range
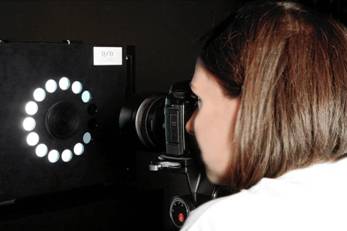
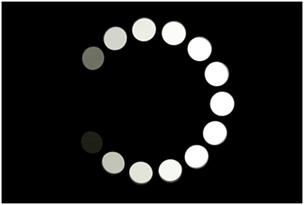
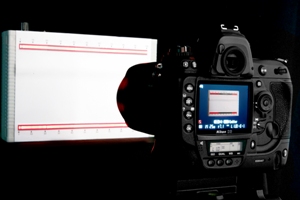
We measure Noise using a transmission target placed on top of a uniform light box. The transmission target is an in-house design made of a thick black plastic plate with precision-drilled holes. These holes (or “patches”) are equipped with range of neutral density filters designed to absorb light in the same way for all wavelengths. The filters are made of pure optical glass with no structures that could be measured as noise. Other image quality measurement solutions make use of printed targets, but we believe such targets are inappropriate for noise measurements, as the intrinsic noise pattern of the paper can be recorded by the tested camera and then confused with a noise pattern. We place high-density filters on neighboring positions to limit reciprocal illumination of the patches.
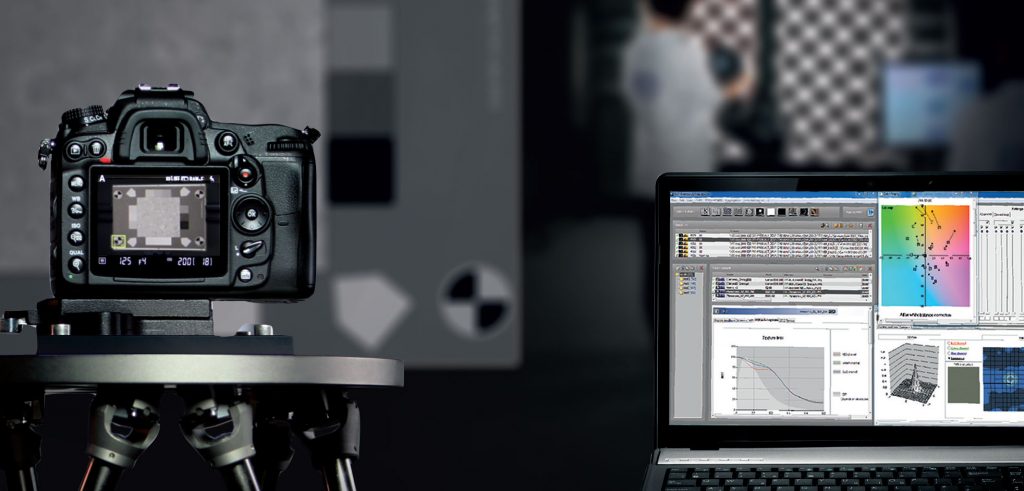
We measure the luminance of each uniform area (patch) on the chart using a certified luminance-meter, and then input the values into DxO Analyzer software. Once we have measured the target and calibrated the DxO Analyzer software, we shoot test images of the noise target at different ISO settings, and measure the Noise for each color channel of the target image (R, Gr, Gb, B). We compute the mean gray level and noise values for each patch and for all images shot at different ISO settings, and finally interpolate these numerical values for all gray levels to calculate and plot signal-to-noise ratio (SNR) curves, from which DxO Analyzer extracts the SNR 18%, the dynamic range, and the tonal range.
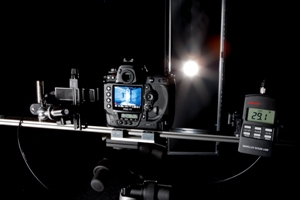
ISO sensitivity
The purpose of the saturation-based ISO sensitivity measurement is to measure the exposure necessary to reach a given sensor’s saturation point. To measure the camera sensor’s ISO sensitivity, we set up the camera body without a lens on a stand to receive light from a controlled source. The light source is positioned far enough away from the camera sensor to ensure good light uniformity on the sensor plane. We then use a certified lux meter to precisely measure the illuminance that the sensor receives.
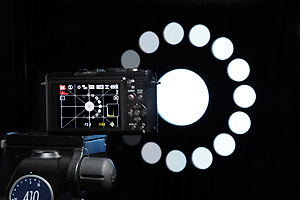
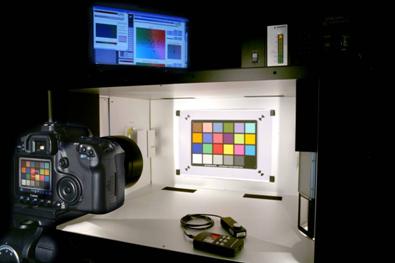
Color sensitivity
Color sensitivity measurement requires knowing the RAW response of the sensor to a selection of known colors. For this purpose, we illuminate an image of a color target with perfectly-known reflectance spectra, using a controlled and spectrally-measured illuminant. We perform all color measurements using a dedicated Kyoritsu color light box, which provides uniform lighting over a surface about 50cm wide. The light box allows us to switch between several normalized illuminants (e.g., A, D65, CW, etc.).The test target is a Gretag Macbeth ColorChecker composed of 18 uniform color patches and 6 gray level patches. For each illuminant, we measure the reflection spectra of the patches with a spectrometer. In a next step, we measure RAW image values. Uniformity of the illuminance is below 7% (checked with a lux-meter).